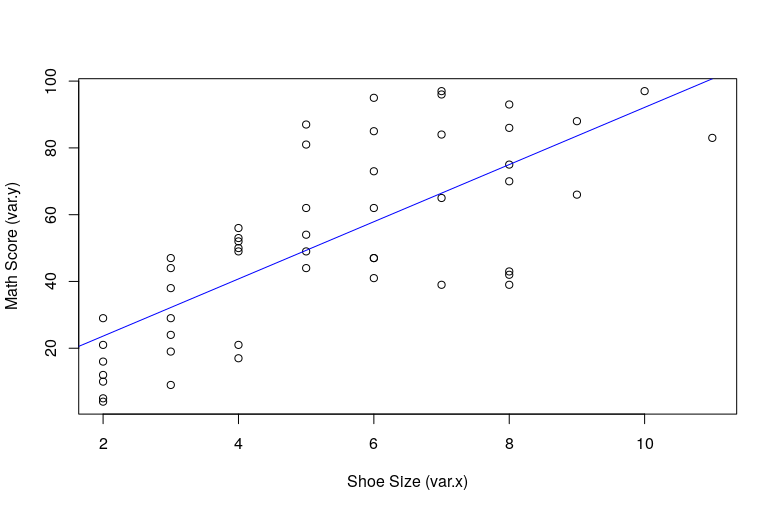
Correlation is a fundamental concept within statistics that, once understood, provides insight into more complex statistical models and ideas. From a conceptual standpoint, correlation summarizes the measured association between variables, meaning the extent to which one variable is affected by the other. Put another way, correlation is simply a measure of association.The term measured association carries a lot of meaning here, so let's unpack it. To calculate the correlation between variables, we first have to measure those variables. The term measured association rather than simply association is a hedge against the possibility that those measures could be inaccurate, and not truly reflect the thing we intend to measure. Science is cautious; and the terms we use reflect that caution. The word association refers to how the data points between variables trend relative to each other. If one goes up does the other go up as well? Or maybe it goes down? Or maybe the change in one does not systematically affect the the other. Of course, this means that we need multiple data points across variables to determine correlation; but more on that in a minute.Association as a concept is a singular thing, but correlation as a measurement is multiple things. There are a variety of way to calculate correlation; and each is responsive to two important data characteristics. The first characteristic is the type of data being analyzed. All data is not created equal. It comes in levels of measurement that are categorized from least to most detailed as: nominal, ordinal, interval, ratio. Nominal is often something like a discrete category (e.g., Democrat, Republican, Libertarian, Independent) and ratio is a continuous measurement where zero represents an absence of the variable (e.g., height, age). Ordinal and interval are somewhere between. The second characteristic is the trend within the data. Data comes in different types of distributions. Imagine having a list of test scores, placing them in order from lowest to highest, plotting them on a graph, and fitting a line that summarizes the trend of the data. That line may be straight (i.e., linear) or curved (non-linear). Correlation is calculated differently based on this trend within the data begin analyzed. When the data we have is at the interval or ratio level of measurement, and we expect the trend of the data to be essentially linear, correlation is measured with a statistic known as Pearson's r, or sometimes simply r. It is measured on a continuous decimal scale from -1 to 1 (Figure 1). The number we arrive upon, called a correlation coefficient, tells us the magnitude (i.e., strength) of the association between the measured variables and the direction (i.e., positive or negative) of that association.